Sustainability Data as Infrastructure

The strategic shift that changes everything about sustainability data: stop treating each report as a one-off deliverable and start building a shared, maintained, reusable data layer. This module makes the case for infrastructure over reports, defines what infrastructure means for sustainability data, shows how one trusted source can feed compliance, strategy and risk at once, counts the hidden cost of fragmentation, and lays out the maturity ladder the rest of the course climbs.

  • data-infrastructure
  • data-reuse
  • maturity-model
  • automation
  • data-strategy
  • single-source-of-truth
12 min · Core

Reports vs Infrastructure

The core mindset shift of the whole course: from producing one-off reports to building a reusable data layer. A report is a finished document; infrastructure is a living foundation that many outputs draw on. This lesson explains why the report-first habit quietly caps a company's value, and what changes when data becomes an asset rather than a deliverable.

~3 min

By the end you can

  • Distinguish a one-off report from a reusable data layer.
  • Explain why the report-first habit limits strategic value.
  • Describe what changes when sustainability data is treated as an asset.
  • Recognise the shift from compliance output to durable capability.

A report ends, infrastructure lasts

Most companies treat sustainability data as something you produce once a year to satisfy a regulator. The finance team, the sustainability lead and a handful of external consultants gather figures from across the business, wrestle them into a document, submit it, and exhale. The report is finished. The data behind it scatters back into inboxes and spreadsheets, and next cycle the whole scramble starts again. This is the report-first habit, and it is the quiet ceiling on what sustainability data can be worth to a company.

The shift in one sentence

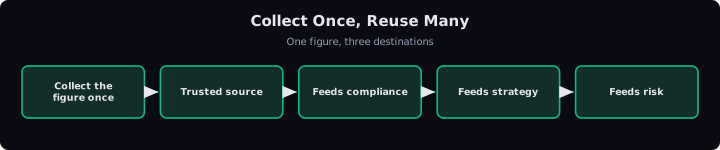
The shift this course teaches is simple to state and hard to internalise: stop producing reports, start building infrastructure. A report is a single, finished output aimed at one audience on one deadline. Infrastructure is a shared, maintained foundation that many outputs draw on again and again. When a Dutch retailer collects its energy-use figures once, into a trusted store the compliance report, the board strategy pack and the procurement risk review can all pull from, the same effort now serves three purposes instead of one. That is the difference between a document and an asset.

Why report-first caps your value

When data exists only inside a finished report, it cannot be reused without being rebuilt. Each new question, from an investor, a lender applying the EU Taxonomy, a large customer demanding supplier emissions, triggers another collection exercise, because nobody kept the underlying numbers in a usable, trusted form. The company pays again and again for information it already had. Worse, each rebuild produces slightly different figures, so the business cannot even trust its own history. Effort compounds, but value does not.

What changes when data becomes an asset

Treating sustainability data as infrastructure changes the questions leaders ask. Instead of asking how do we get this year's report out, they ask what foundation lets every future report, decision and disclosure draw on the same trusted numbers. The reporting deadline stops being the goal and becomes one output among many. Compliance, which felt like pure cost, starts funding a capability the business can use for strategy and risk. The report still gets filed, but now it is a by-product of something that keeps paying back.

The rest of the course

Every later idea in this course rests on this shift. Collecting once and reusing many times, the true cost of fragmentation, and the maturity ladder from spreadsheets to a trusted automated layer, all follow from choosing infrastructure over reports. Hold on to the distinction: a report is what you hand in, infrastructure is what you build. One ends on the deadline, the other keeps working long after.
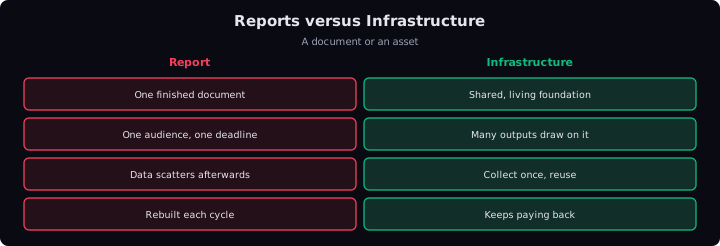
A report ends on the deadline; infrastructure is a maintained foundation many outputs draw on.

Check your understanding

Answer each from memory. Your results are saved in this browser and count toward your readiness — sign in (account panel above) to keep them across devices.

  1. What best captures the core shift this course teaches?

  2. Why does the report-first habit quietly cap a company's value?

  3. Once sustainability data is treated as an asset, which question do leaders start asking?
12 min · Core

What Infrastructure Means Here

Infrastructure is a word borrowed from plumbing and roads for a reason. This lesson makes the analogy concrete: a shared, maintained, reusable foundation for sustainability data made of four parts, the sources that supply it, the pipes that move it, a trusted store that holds it, and the outputs that draw on it. Understanding these four parts gives leaders a shared vocabulary for the rest of the course.

~4 min

By the end you can

  • Define data infrastructure by analogy to physical infrastructure.
  • Name the four parts: sources, pipes, a trusted store and outputs.
  • Explain why the store being trusted is the load-bearing part.
  • Recognise that infrastructure must be maintained, not built once.

Why the word infrastructure fits

We call roads, water mains and the electricity grid infrastructure because they are shared, they are maintained, and countless people reuse them without rebuilding them each time. You do not lay your own pipe every time you want a glass of water; you turn a tap connected to a system someone keeps running. Sustainability data can work the same way. The point of the analogy is not decoration. It tells leaders exactly what to build: a shared, maintained, reusable foundation that any team can draw from without starting over.

The four parts

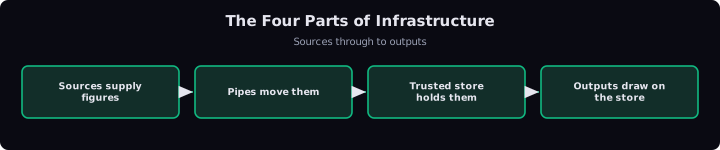
Sustainability data infrastructure has four parts, and it helps to name them plainly. SourcesWhere raw sustainability figures originate: energy meters, HR systems, supplier invoices, fuel cards, waste contractors and similar. are where the raw figures come from: energy meters, HR systems for headcount and travel, supplier invoices, fleet fuel cards, waste contractors. PipesHow figures move from sources into the trusted store, whether an automated feed or, at lower maturity, a person copying numbers by hand. are how those figures move from the sources into one place, whether that is an automated feed or, at first, a person copying numbers. A trusted store is the single place the cleaned, checked figures live, with clear definitions and a record of where each number came from. Outputs are everything that draws on the store: the compliance report, the board pack, the investor questionnaire, the procurement risk review.

The store is the load-bearing part

Of the four, the trusted store is what makes infrastructure infrastructure. Sources and pipes exist in every company already, however messy. Outputs are always demanded. What most companies lack is a single, trusted place in the middle that everything else agrees to use. Trusted means three things: the figures are defined the same way for everyone, their origin can be traced, and they have been checked. Without a trusted store, you do not have infrastructure, you have a pile of sources feeding a pile of reports, with no shared truth between them.

Infrastructure is maintained, not finished

A road is not built once and forgotten; it is resurfaced, inspected and repaired. Data infrastructureA shared, maintained, reusable foundation for sustainability data, made of sources, pipes, a trusted store and outputs, that many teams draw on without rebuilding it each time. is the same. New sources appear as the business grows, definitions change as regulation like the EU's CSRDThe EU's Corporate Sustainability Reporting Directive, which brings external assurance to sustainability figures much as financial accounts are audited, raising the cost of data errors. evolves, and figures need re-checking each cycle. Treating the store as a living system with an owner, rather than a project that ends, is what keeps it trustworthy. A neglected data store rots exactly like a neglected bridge, quietly, until the day it fails under load.

A shared vocabulary

These four words, sources, pipes, store, outputs, give the whole organisation a common way to talk about sustainability data. When the finance director, the IT lead and the procurement head all picture the same four parts, they can locate any problem: is it a bad source, a broken pipe, an untrusted store, or an output asking for something the store does not yet hold? That shared map is the practical payoff of the infrastructure idea.

Sources feed pipes into a trusted store, which is the load-bearing part every output draws upon.

Check your understanding

Answer each from memory. Your results are saved in this browser and count toward your readiness — sign in (account panel above) to keep them across devices.

  1. What are the four parts of sustainability data infrastructure?

  2. Why is the trusted store described as the load-bearing part?

  3. What does 'infrastructure is maintained, not finished' mean in practice?

13 min · Core

Collect Once, Reuse Many

The single most valuable habit infrastructure unlocks: gather each figure once into a trusted source, then let compliance reporting, strategy and risk all draw on it, instead of re-collecting the same numbers for each purpose. This lesson shows the pattern with concrete European examples and explains why one trusted source beats three separate collection exercises every time.

~4 min

By the end you can

  • State the collect-once, reuse-many principle in plain terms.
  • Show one trusted source feeding compliance, strategy and risk.
  • Explain why re-collecting for each purpose is slower and less trustworthy.
  • Recognise reuse as the return on the infrastructure investment.

Gather each number once

The principle is short: collect each figure once, into a trusted source, then reuse it for every purpose that needs it. A German manufacturer measures the energy its plants consume. That single, checked figure can serve the CSRDThe EU's Corporate Sustainability Reporting Directive, which brings external assurance to sustainability figures much as financial accounts are audited, raising the cost of data errors. compliance report, the board's decarbonisation strategy and the supply-chain risk review, without being gathered three separate times. The number does not change depending on who asks; only the way it is presented does. So it should be collected once and drawn on many times.

One source, three destinations

Picture the same energy figure flowing to three places. For compliance, it fills the mandatory emissions disclosure exactly as the regulator defines it. For strategy, it shows the board which sites drive the most emissions and where investment in efficiency would pay back fastest. For risk, it tells the procurement team which operations are most exposed to energy-price shocks and carbon costs. Three very different decisions, one underlying number. That is the reuse the infrastructure exists to enable.

The re-collection trap

Contrast this with how most organisations actually work. The compliance team collects energy data in spring for the report. In summer, strategy asks the same plants for the same figures in a different template. In autumn, procurement runs its own request for the risk review. Three teams, three requests, three formats, three chances for the plants to answer slightly differently. The business spends triple the effort and ends up with three versions of one truth, none of which quite agree. When an auditor or an investor asks which number is right, nobody can say with confidence.

Why one trusted source wins

A single trusted source is faster because the gathering happens once. It is more trustworthy because there is one agreed figure with a known origin, not three rival copies. And it is more useful, because once a number is in the store, answering a new question, say a customer suddenly demanding your Scope 3 supplier emissions, means drawing on data you already hold rather than launching a new hunt. The marginal cost of the next use falls towards zero. That falling marginal cost is precisely what makes data behave like infrastructure rather than like a series of expensive one-offs.

Reuse is the return

Building the trusted source costs real effort up front, and leaders reasonably ask what they get for it. The answer is reuse. The first use, the compliance report, might merely break even against the old way. Every use after that, strategy, risk, investor questions, customer demands, is close to free because the data is already there, defined and checked. Infrastructure pays back not on the first output but on the tenth. Collect once, reuse manyThe principle of gathering each figure a single time into a trusted source, then reusing it for compliance, strategy, risk and any other purpose, rather than re-collecting it for each. is the sentence that turns a cost centre into an asset.

One trusted energy figure feeds compliance, strategy and risk without being gathered three separate times.

Check your understanding

Answer each from memory. Your results are saved in this browser and count toward your readiness — sign in (account panel above) to keep them across devices.

  1. What is the collect-once, reuse-many principle?

  2. Which three destinations can a single trusted figure feed?

  3. Why does the re-collection approach produce weaker, less trustworthy data?

13 min · Core

The True Cost of Fragmentation

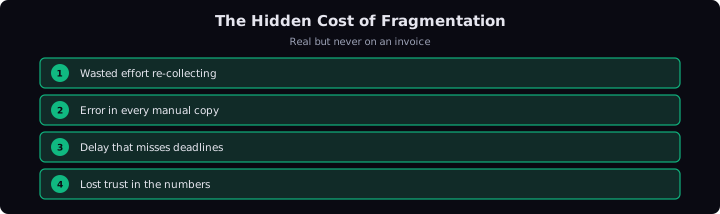
Fragmentation, the same data scattered across teams, spreadsheets and formats, carries a hidden cost that never appears on an invoice. This lesson counts it in four currencies: wasted effort re-collecting and reconciling, errors that creep into every manual copy, delay that misses deadlines and decisions, and the slow erosion of trust when your own numbers disagree. Naming the cost is the first step to justifying the fix.

~4 min

By the end you can

  • Define fragmentation and where it comes from.
  • Count the four hidden costs: effort, error, delay and lost trust.
  • Explain why these costs stay invisible on the books.
  • Use the cost of fragmentation to justify infrastructure investment.

What fragmentation is

FragmentationThe state where the same sustainability figures live in many places, held by different teams in different formats and definitions, with no single authoritative copy. is the state most companies are already in: the same sustainability figures live in many places, held by different teams, in different spreadsheets, defined in different ways. The plant records energy in one format, finance holds a different version for cost, and the sustainability team keeps a third for the report. No single copy is authoritative. Fragmentation is the natural result of the report-first habit, because when data exists only to feed one document, nobody is responsible for keeping a shared version.

The first cost: wasted effort

Every reporting cycle, someone has to re-collect figures that already exist somewhere and then reconcile the copies that disagree. A French logistics group might spend weeks each year chasing fuel data across depots and arguing over which spreadsheet is right. That labour produces nothing new; it merely rebuilds what fragmentation destroyed. It is pure waste, and it recurs every single cycle.

The second cost: error

Every manual copy is a chance to introduce a mistake. A figure transcribed from an invoice into a spreadsheet, then into a report, passes through several hands, and each hand can drop a digit or misread a unit. Fragmented data multiplies these hand-offs, so errors accumulate. Under the EU's CSRDThe EU's Corporate Sustainability Reporting Directive, which brings external assurance to sustainability figures much as financial accounts are audited, raising the cost of data errors., where sustainability figures now face external assurance much like financial accounts, an error is no longer just embarrassing; it can mean a qualified audit opinion.

The third cost: delay

Fragmentation is slow. When the numbers are scattered, assembling them for a deadline takes weeks that a trusted store would make minutes. That delay does more than strain the reporting team. It means strategic questions, which site to invest in, which supplier to drop, wait on data that arrives too late to act on. A decision delayed by a data hunt is often a decision not made at all.

The fourth cost: lost trust

The most damaging cost is the quietest. When a company's own numbers disagree, and someone notices that the figure in the board pack does not match the figure in the report, confidence erodes. Executives start hedging decisions because they no longer believe the data. Investors and regulators, once they spot an inconsistency, begin to question everything. Trust is expensive to build and cheap to lose, and fragmentation spends it a little at a time.

Why the cost stays hidden, and why naming it matters

None of these four costs appears as a line on the accounts. There is no invoice for effort re-spent, no charge for a decision delayed, no debit for eroded trust. That is exactly why fragmentation persists: it is expensive but invisible, so it never triggers action. The purpose of counting it, in effort, error, delay and lost trust, is to make the invisible visible. Once leaders can see the recurring cost of the status quo, the case for investing in infrastructure stops being abstract and becomes a plain comparison: pay once to build the store, or pay forever to work around not having one.

Fragmentation is counted in four currencies that never appear as a line on the accounts.

Check your understanding

Answer each from memory. Your results are saved in this browser and count toward your readiness — sign in (account panel above) to keep them across devices.

  1. What are the four hidden costs of fragmentation?

  2. Why do the costs of fragmentation usually stay invisible?

  3. Under the EU's CSRD, why has the error cost of fragmentation become sharper?

13 min · Core

The Infrastructure Maturity Ladder

Nobody jumps straight to trusted, automated infrastructure. This lesson lays out the four rungs every organisation climbs: ad-hoc spreadsheets, consolidated, automated, and trusted. Knowing which rung you are on tells you what the next move is, and the whole rest of the course is a guided climb from wherever you stand today towards a data layer the business can rely on.

~4 min

By the end you can

  • Name the four rungs of the maturity ladder in order.
  • Describe what characterises each rung.
  • Diagnose which rung an organisation is currently on.
  • Explain why each rung must be climbed in order, not skipped.

A ladder, not a switch

Becoming data-mature is a climb, not a purchase. There is no product that lifts a company from scattered spreadsheets to a trusted automated layer overnight. Instead there are four rungs, and progress means moving up one at a time. Naming the rungs does two things: it tells you honestly where you stand, and it tells you what the single next move is. Everything else in this course is a guided climb up this ladder.

Rung one: ad-hoc spreadsheets

At the bottom, sustainability data lives in personal spreadsheets, gathered by hand each cycle, owned by whoever happens to do it. Nothing is standardised; a definition lives in someone's head. This is where most organisations start, and there is no shame in it, but it is fragile: when the person leaves, the knowledge leaves, and every cycle is a fresh scramble. The tell-tale sign of rung one is that the last report was rebuilt almost from scratch.

Rung two: consolidated

On the second rung, the scattered spreadsheets are pulled into one place with shared definitions, even if a person still does the pulling by hand. There is now a single version of each figure that teams agree to use. Consolidation is the first real step towards infrastructure, because it creates the trusted store, manually maintained for now. The tell-tale sign of rung two is that everyone knows which file is the authoritative one.

Rung three: automated

On the third rung, the pipes stop being people. Data flows from sources into the store through automated feeds, so figures arrive without manual copying. Automation attacks the error and delay costs directly: fewer hands mean fewer mistakes, and continuous feeds mean the store is current, not assembled in a panic before a deadline. The tell-tale sign of rung three is that a figure updates in the store without anyone re-typing it.

Rung four: trusted

The top rung is not a new technology but a state of confidence. The data is defined consistently, its origin is traceable, it is checked and, increasingly, externally assured. Leaders act on it without hedging, and auditors and investors accept it. Trusted is the rung where sustainability data finally behaves like financial data: something the business relies on for real decisions. It is the destination the whole infrastructure idea is aimed at.

Climb in order

The rungs cannot be skipped. Automating scattered, undefined spreadsheets just produces wrong answers faster, so consolidation must come before automation. And trust is earned on top of consolidated, automated data, not bolted on at the end. Diagnose your rung honestly, was the last report rebuilt from scratch, is there one authoritative file, do figures update without re-typing, do leaders act on the data without hedging, and take the single next step. That disciplined, one-rung-at-a-time climb is the arc of everything that follows.

Organisations climb from ad-hoc spreadsheets to a trusted layer, and no rung can be skipped.

Check your understanding

Answer each from memory. Your results are saved in this browser and count toward your readiness — sign in (account panel above) to keep them across devices.

  1. What are the four rungs of the maturity ladder, in order?

  2. Why must an organisation consolidate before it automates?

  3. What characterises the top rung, 'trusted'?

Flashcards

Recall-first review of the load-bearing facts.

0 reviewed · 8 left

Ready to test yourself?

12 graded questions with real explanations. You commit a confidence before each reveal — that is how you find what you only think you know.

Start practice quiz →
Sustainability Data as Infrastructure — Sustainability Data as Infrastructure | Contested Futures Academy · The Contested Futures Institute