The Supply-Chain Data Problem

For most European businesses the largest and least trustworthy part of their sustainability data comes from the supply chain, not from their own operations. This module takes on the hardest problem in the whole domain: value-chain emissions and supplier information that a company does not own, cannot fully verify, and yet must report and stand behind. It brings the DSI lens of weaponised interdependence to bear, treating dependency in the supply chain as both a sustainability figure and a strategic-risk signal, and ends by turning supplier sustainability data into supply-chain resilience.

  • scope-3
  • supplier-data
  • supply-chain-risk
  • weaponised-interdependence
  • data-governance
  • resilience
13 min · Core

Scope 3: The Hard Problem

Scope 3 covers the emissions that happen across a company's value chain rather than at its own sites, and for most firms it is by far the largest slice of the total. It is also the hardest to measure, because you do not own the activity, the numbers are often estimated rather than counted, and the sources sit inside hundreds of other companies you cannot control.

~3 min

By the end you can

  • Explain what Scope 3 covers and how it differs from Scopes 1 and 2.
  • Describe why value-chain emissions usually dominate a company's total footprint.
  • Identify the three reasons Scope 3 is the hardest category to measure.
  • Recognise why Scope 3 cannot be treated like the data a firm controls itself.

Three scopes, one uneven split

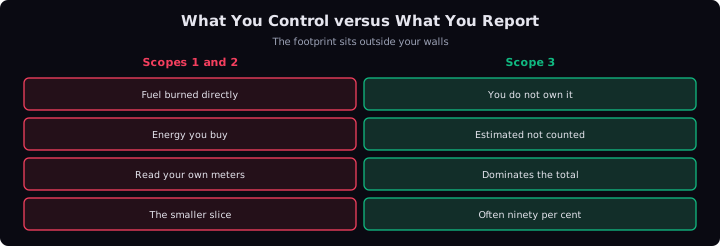
Emissions are usually sorted into three scopes. Scope 1 is what a company burns directly, such as fuel in its own vehicles and boilers. Scope 2 is the energy it buys, mainly electricity. Scope 3Emissions across a company's value chain rather than at its own sites, from purchased materials, transport, business travel and the use of sold products. For most firms it is the largest and hardest category. is everything else across the value chain: the emissions embedded in the materials a firm purchases, the transport that moves its goods, the business travel of its staff, and the use of its products once sold. The split between these three is rarely even. For a bank, a retailer or a car maker, Scope 3 can be eighty or ninety per cent of the whole footprint. The part a company controls least is the part that matters most.

Why it dominates

Consider a supermarket chain. Its own shops use electricity and refrigeration, which shows up in Scopes 1 and 2. But the emissions from growing, processing and shipping every product on its shelves dwarf that. A single loaf of bread carries the emissions of the wheat farm, the mill, the bakery and the lorry. Multiply that across tens of thousands of products and thousands of suppliers, and the store's own energy bill looks small. This is the uncomfortable pattern almost everywhere: the biggest lever on a company's footprint sits outside its walls, in decisions made by other firms.

Why it is the hard problem

Three things make Scope 3 the hard problem. First, you do not own the activity. The emissions belong to a supplier's factory or a customer's use of your product, so you cannot simply read a meter. Second, the numbers are estimated, not counted. Where a real figure is missing, firms fall back on averages, spend-based factors and industry assumptions, which are rough by nature. Third, it dominates the total, so the least reliable part of the data is also the largest, which means the error sits exactly where it hurts. A company can measure its own energy to the kilowatt-hour and still have most of its footprint resting on guesswork.

Why the usual approach fails here

Everything a firm learned about controlling its own data breaks down at the value-chain boundary. Inside the company it can install meters, set standards and enforce a process. Across the supply chain it has none of that power; it can only ask, and hope the answer is sound. Treating Scope 3 like Scope 1, expecting to command the numbers into existence, leads straight to a report full of figures the company cannot defend. The rest of this module accepts the hard truth of Scope 3 and asks the real question: how do you work with data you do not own, cannot fully verify, and still have to publish.
The part a company controls least is usually the part that matters most.

Check your understanding

Answer each from memory. Your results are saved in this browser and count toward your readiness — sign in (account panel above) to keep them across devices.

  1. What does Scope 3 cover?

  2. Why does Scope 3 usually dominate a company's total footprint?

  3. Which set best captures the three reasons Scope 3 is the hardest category to measure?
13 min · Core

Trusting Data You Do Not Own

Supplier data comes in two very different qualities: primary data, measured and reported by the supplier itself, and estimated data, inferred from spend or industry averages. Most of what a company reports today is the weaker kind. This lesson explains the trust gap that opens when the largest part of your footprint rests on numbers you cannot verify and did not produce.

~3 min

By the end you can

  • Distinguish primary supplier data from estimated and spend-based data.
  • Explain why spend-based estimates are convenient but weak.
  • Describe what verifying a supplier-reported figure actually requires.
  • Name the trust gap created by depending on data you do not own.

Two grades of supplier data

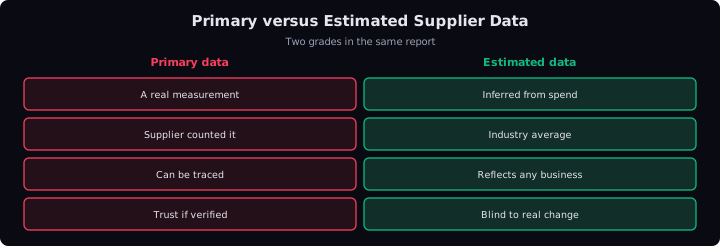
Not all supplier data is the same. Primary dataA real measurement of emissions or resource use reported by the supplier that actually produced the activity, as opposed to a figure inferred from averages. is a real measurement: the supplier counted its own energy and emissions for the product you bought and sent you that figure. Estimated dataA figure inferred rather than measured, most often by multiplying money spent with a supplier by an industry-average emissions factor. Convenient but insensitive to a real supplier's performance. is inferred, most often by taking the money you spent with a supplier and multiplying it by an industry average for that kind of business. If you spent one hundred thousand euros with a steel maker, a spend-based factor turns that into an emissions figure without anyone measuring anything. The two grades can differ enormously for the same purchase, yet both end up as a single number in the same report.

Why estimates are convenient but weak

Spend-based estimates are popular because they are easy. You already have the purchase ledger, so you can produce a full Scope 3Emissions across a company's value chain rather than at its own sites, from purchased materials, transport, business travel and the use of sold products. For most firms it is the largest and hardest category. figure without asking a single supplier for anything. The weakness is that the estimate reflects an average business, not your actual supplier. Two steel makers, one running on coal and one on clean hydrogen, would generate the same estimate from the same spend, even though their real emissions differ by a wide margin. So the number moves when your spending changes but barely responds when a supplier genuinely cleans up its operations. It satisfies a reporting box while telling you almost nothing you can act on.

What verifying a supplier figure really takes

Primary data is better, but only if you can trust it, and trusting a number a supplier hands you is not automatic. Verification means being able to ask where the figure came from, on what boundary it was calculated, whether it was itself measured or estimated further down the chain, and whether anyone independent has checked it. A supplier that sends a confident carbon figure with no method behind it has given you a number, not evidence. Real verification often means asking for the supplier's own assurance, or sampling and challenging the figures, the same scrutiny finance applies to any claim it must stand behind.

The trust gap

Here is the bind. The largest part of your footprint depends on data produced by other companies, to their own standards, for their own reasons, and you must publish it as if it were your own. That is the trust gap: the distance between a number you can defend and a number you merely received. Close it and your supply-chain data becomes an asset. Leave it open and you are signing your name to figures you cannot explain. The next lessons show that closing this gap is not only a data task; it is also where sustainability data starts to reveal strategic risk.

The trust gap is the distance between a figure you can defend and one you merely received.

Check your understanding

Answer each from memory. Your results are saved in this browser and count toward your readiness — sign in (account panel above) to keep them across devices.

  1. What is the difference between primary and estimated supplier data?

  2. Why is a spend-based emissions estimate convenient but weak?

  3. What is the trust gap in supply-chain sustainability data?

14 min · Core

Weaponised Interdependence

This is the DSI lens applied to sustainability data. The same supplier map that tells you your emissions also tells you where you are dependent, who has leverage over whom, and where concentration risk sits. Read this way, a Scope 3 dataset is not only a compliance artefact; it is a picture of strategic exposure that a competitor, a state or a shock could exploit.

~3 min

By the end you can

  • Explain the idea of weaponised interdependence in plain terms.
  • Show how a supplier emissions map doubles as a dependency map.
  • Identify concentration risk hidden inside supply-chain data.
  • Recognise sustainability data as a strategic-risk signal, not only a report input.

Dependency as leverage

Weaponised interdependenceThe concept that the dependencies making an economy efficient also create chokepoints, giving whoever controls a critical supplier, material or route leverage over everyone downstream. is the idea that the links which make an economy efficient also create points of control. When many firms depend on one supplier, one material or one country, whoever sits at that chokepoint gains leverage over everyone downstream. They can raise prices, withhold supply, attach conditions, or simply see what everyone who passes through them is doing. Efficiency and vulnerability turn out to be the same structure viewed from two sides. The firm that mapped its supply chain only to count carbon has, without meaning to, drawn a map of who could squeeze it.

The emissions map is a dependency map

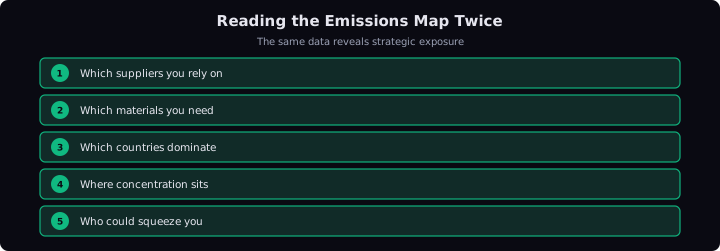
Here is the insight this module turns on. To calculate Scope 3Emissions across a company's value chain rather than at its own sites, from purchased materials, transport, business travel and the use of sold products. For most firms it is the largest and hardest category., a company must chart its value chain: which suppliers, which materials, which countries, how much of each. That is exactly the information a strategist wants for a different purpose. The same table that says a battery maker's emissions come mostly from refined lithium also says the firm depends on a handful of refineries, most in one country, for the input it cannot do without. One reading is a sustainability figure; the other is a strategic exposure. They are the same data. A business that files the first and never reads the second is leaving intelligence on the table.

Concentration riskDependency piled onto a single supplier, material or region. Comfortable while conditions are calm, it becomes catastrophic when a shock, sanction or price rise hits that one point. in plain sight

Concentration risk is dependency piled onto a single point. A car maker might find that ninety per cent of a critical component traces back to one region, or that a single supplier sits behind a dozen of its products. The emissions data shows this plainly, because it forces the firm to ask where each input really comes from. Concentration is comfortable while things are calm and catastrophic when they are not: a flood, a sanction, an export licence or a price shock at that one point ripples through everything built on it. The very act of measuring the footprint surfaces the fragility.

Reading data as a signal

So the DSI lens says: read your supply-chain sustainability data twice. Once for the report, and once for what it reveals about power. Where are you dependent, and on whom. Who could raise your cost or halt your line. Which single points, if they failed, would take much of your business with them. A supplier that dominates your footprint also dominates your exposure, and a country that refines the mineral you rely on knows your dependency better than your own board does. Understood this way, sustainability data becomes an early-warning system for strategic risk, and the next lesson turns to governing it so it can carry that weight.

A Scope 3 dataset is also a map of who holds leverage over the firm downstream.

Check your understanding

Answer each from memory. Your results are saved in this browser and count toward your readiness — sign in (account panel above) to keep them across devices.

  1. What does weaponised interdependence mean?

  2. Why is a supplier emissions map also a dependency map?

  3. What is concentration risk in a supply chain?

12 min · Core

Supplier Data Governance

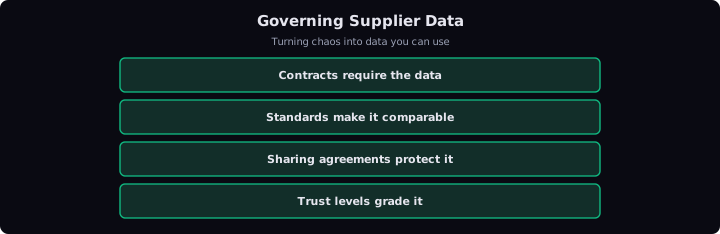
Good supplier data does not appear because you ask nicely. It appears because contracts require it, standards define it, data-sharing agreements protect it, and everyone knows how much to trust each figure. This lesson covers the governance that turns a flood of inconsistent supplier submissions into data a company can actually use and defend.

~3 min

By the end you can

  • Explain why supplier data needs governance, not just requests.
  • Describe how contracts and standards make supplier data comparable.
  • Explain the role of data-sharing agreements and confidentiality.
  • Describe a trust level and why grading data matters.

Why asking is not enough

A company that simply emails its suppliers for emissions figures gets chaos back: different units, different boundaries, different years, some measured and some guessed, many missing. The data is unusable not because suppliers are unwilling but because nothing defined what a good answer looks like. Governance is the difference between a request and a requirement. It sets out what data is needed, in what form, to what standard, with what proof, and what happens if it does not arrive. Without it, every reporting cycle starts from the same confusion.

Contracts and standards make data comparable

The strongest lever is the contract. When a supply agreement states that the supplier must provide primary emissions data, calculated to a named standard, by a set date, the figure stops being a favour and becomes a deliverable like any other. Standards do the rest: if every supplier reports on the same boundary and in the same units, the numbers can be added up and compared rather than argued over. A retailer that writes a clear data clause into its supplier terms will, a year later, hold figures it can actually total, while a competitor that only sent polite emails is still chasing PDFs. The contract is where trust begins.

Data-sharing agreements and confidentiality

Suppliers often hesitate to share real figures because those figures reveal something commercially sensitive, such as their energy costs or their own dependencies. A data-sharing agreement addresses that fear directly: it sets out how the data will be used, who can see it, that it will not be passed to competitors, and how it is protected. Handled well, this is also a security matter, because supplier data aggregated across a whole chain is valuable and must be held safely. Suppliers share more, and more honestly, when they trust how their data will be treated, so the agreement is not red tape but the thing that unlocks primary data.

Trust levels: knowing how much to believe

Not every figure deserves equal confidence, and mature governance says so openly. A trust level is a simple grade attached to each data point: measured and independently assured sits at the top, supplier-measured but unverified in the middle, spend-based estimate at the bottom. Grading data this way is honest and useful. It tells the firm where its footprint rests on solid ground and where it rests on guesswork, so it knows which suppliers to press for better data and where its own report is weakest. Governance, then, is not bureaucracy; it is what makes supplier data usable, defensible and safe, and it is the foundation for turning that data into resilience.

Governance is the difference between a request and a requirement suppliers must meet.

Check your understanding

Answer each from memory. Your results are saved in this browser and count toward your readiness — sign in (account panel above) to keep them across devices.

  1. Why does simply emailing suppliers for figures produce unusable data?

  2. How does a contract make supplier data comparable and usable?

  3. What is a trust level, and why grade data with one?

13 min · Core

From Scope 3 to Resilience

The payoff of all this effort is not a cleaner report. It is supply-chain resilience. The same supplier data gathered for Scope 3, once trusted and read strategically, becomes risk intelligence: it shows where the business is fragile, which dependencies to diversify, and where to act before a shock forces the decision. This lesson turns sustainability data into resilience decisions.

~3 min

By the end you can

  • Explain how trusted Scope 3 data becomes supply-chain risk intelligence.
  • Describe resilience decisions that supplier data can inform.
  • Show why acting on the data early beats reacting to a shock.
  • Recognise resilience as the real return on supply-chain sustainability data.

From a report to intelligence

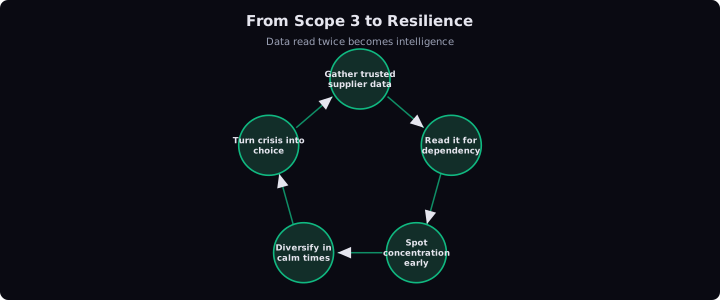
Once supplier data is trusted and read for what it reveals about dependency, it stops being a filing exercise and becomes risk intelligence. A firm that knows, supplier by supplier, where its materials come from, how concentrated each source is, and how exposed each supplier is to carbon cost or disruption, holds a live picture of its own fragility. That picture is worth far more than the emissions total it was built to produce. The report was the excuse to gather the data; resilience is the reward for gathering it well.

Decisions the data can drive

Trusted supply-chain data informs concrete choices. If the data shows that a single region supplies most of a critical input, the firm can qualify a second source before it is forced to. If a key supplier carries high emissions that will attract future carbon costs, the firm can redesign the product or switch materials while it still has time. If a supplier refuses to share any data at all, that silence is itself a signal about how much of the chain the firm cannot see. Each of these is a resilience decision, and each rests on data first collected to satisfy a sustainability rule.

Why acting early wins

The advantage of reading the data this way is timing. A company that waits for a flood, a sanction or a sudden price rise to reveal its dependency reacts under pressure, at the worst possible cost, alongside every competitor scrambling for the same alternative. A company that read its own supplier map in calm times saw the concentration coming and diversified quietly and cheaply. The data does not remove the shock, but it moves the decision from crisis to choice. That difference, between being surprised and being prepared, is what resilience actually means.

The real return

This is where the whole module lands. The effort of gathering, verifying and governing supplier data is often justified only as the cost of compliance, and read that way it looks like overhead. Read correctly, it is an investment in knowing your own business. The firm that treats Scope 3Emissions across a company's value chain rather than at its own sites, from purchased materials, transport, business travel and the use of sold products. For most firms it is the largest and hardest category. as a chore ends with a report and nothing more. The firm that treats it as intelligence ends with a report and a map of its own vulnerabilities, early enough to do something about them. Supply-chain sustainability data, gathered well and read twice, is one of the clearest windows a business has into its strategic risk, and turning that window into resilience is the point of the work.

Acting on the map in calm times beats scrambling under a shock alongside every rival.

Check your understanding

Answer each from memory. Your results are saved in this browser and count toward your readiness — sign in (account panel above) to keep them across devices.

  1. How does trusted Scope 3 data become supply-chain risk intelligence?

  2. Which is a resilience decision that trusted supplier data can inform?

  3. Why does acting on the data early beat reacting to a shock?

Flashcards

Recall-first review of the load-bearing facts.

0 reviewed · 8 left

Ready to test yourself?

12 graded questions with real explanations. You commit a confidence before each reveal — that is how you find what you only think you know.

Start practice quiz →
The Supply-Chain Data Problem — Sustainability Data as Infrastructure | Contested Futures Academy · The Contested Futures Institute