Where the Data Lives

Before a business can trust its sustainability data, it has to know where that data actually is. This module walks the terrain: the categories of data a company produces, the operational systems where those numbers quietly originate, the ungoverned spreadsheets and supplier PDFs where trust breaks, and the difference between who produces, who holds and who reports a figure. It ends with the first practical move of the whole course, drawing a data map, and argues that the map is step one to treating sustainability data as infrastructure.

  • data-mapping
  • systems-of-record
  • data-ownership
  • sustainability-data
  • shadow-data
  • value-chain-data
12 min · Core

Mapping the Sources

Sustainability data is not one thing from one place. It falls into a handful of families, energy, emissions, resource and waste, supplier and value-chain, and social and workforce, and each family originates somewhere different. Knowing the families and where they come from is the first step to finding the data at all.

~4 min

By the end you can

  • Name the main families of sustainability data a business produces.
  • Explain where each family typically originates inside or outside the firm.
  • Recognise that different families follow different units and update cycles.
  • Distinguish data the firm generates itself from data it must gather from others.

Five families, not one number

A leader asked to find the company's sustainability data often looks for a single file and finds nothing useful. The data does not work that way. It sorts into a handful of families, and each behaves differently. Energy data records how much electricity, gas and fuel the business consumes across its sites and vehicles. Emissions data translates that activity, and much more, into greenhouse gases. Resource and waste data tracks water drawn, materials used and waste sent to landfill or recycling. Supplier and value-chain data covers everything that happens beyond the company's own walls, at the firms that supply it and carry its goods. Social and workforce data counts people: headcount, safety incidents, pay gaps and conditions in the supply chain. Naming these families is the first act of finding them.

Each family is born somewhere different

The families matter because each originates in a different place. Energy data is born in utility bills and meter readings held by facilities teams. Emissions data is rarely measured directly; it is calculated by taking the energy and activity figures and applying conversion factors, so its origin is really the origin of the inputs. Waste and water data comes from waste contractors and site records. Social data lives in human-resources and payroll systems. And value-chain data does not originate inside the company at all: it has to be collected from hundreds of suppliers who each hold their own piece. A firm that assumes all this sits in one system has misunderstood the terrain before it starts.

Different units, different clocks

Because the families come from different places, they arrive in different units and on different clocks. Energy comes in kilowatt-hours, monthly. Emissions are expressed in tonnes of carbon dioxide equivalent, often calculated once a year. Water arrives in cubic metres, safety data as incident counts per period, supplier data whenever a supplier chooses to answer. A retailer pulling a single footprint figure must reconcile a monthly electricity meter, an annual supplier estimate and a quarterly waste report, each measured differently. This mismatch is one reason the numbers are hard to combine, and it is invisible until you list the families side by side.

Made here, or gathered from others

The most useful early distinction is between data the firm generates itself and data it must gather from others. Energy, waste, water and workforce data are largely the company's own: it controls the source and can improve it. Value-chain and much supplier data belong to other organisations, so the company can only request, chase and estimate. This line predicts where the difficulty will fall. The families a firm owns can be fixed with better internal systems; the families it must gather depend on relationships and persuasion. Seeing that split at the outset tells a leader where the easy wins and the hard slog will be.
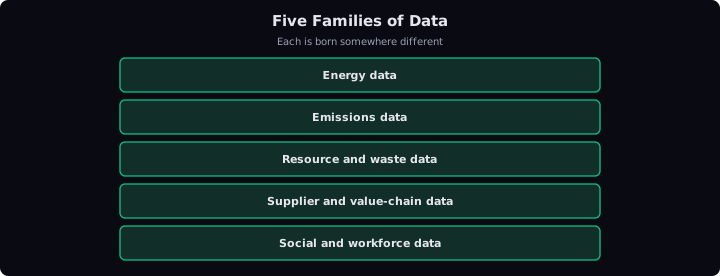
Sustainability data sorts into five families, each with its own source, units and update cycle.

Check your understanding

Answer each from memory. Your results are saved in this browser and count toward your readiness — sign in (account panel above) to keep them across devices.

  1. Which of these best lists the main families of sustainability data?

  2. Why does emissions data not have a single direct source of its own?

  3. Which data family does a company usually have to gather from other organisations rather than generate itself?
13 min · Core

The Systems of Record

Most sustainability data already exists inside a company, but not in a sustainability system. It hides inside the everyday operational systems that run the business: the ERP, the procurement platform, the HR system, the environmental and safety records, and the pile of utility bills and meter readings. Learning where the data hides is what turns a hunt into a plan.

~3 min

By the end you can

  • Define a system of record and why it matters for sustainability data.
  • Identify the everyday systems where sustainability data already sits.
  • Explain why the data hides rather than announcing itself.
  • Match a sustainability figure to the operational system likely to hold it.

The data is already there

A common assumption is that a company must go out and collect its sustainability data from scratch. In truth most of it is already inside the business, sitting in the systems that run daily operations. The problem is not that the data is missing; it is that it lives in systems built for other purposes, labelled in other ways, and owned by teams who never thought of it as sustainability data at all. The work is less collection than discovery, and discovery starts with knowing which systems to open.

What a system of record is

A system of record is the authoritative place where a particular kind of information is first captured and officially kept, the source everyone should trust for that fact. For money, it is the accounting system. For staff, it is the HR system. Sustainability data has no single system of record of its own yet, which is exactly the trouble; instead its pieces are scattered across the systems of record of other functions. Knowing this reframes the task: a leader is not looking for a sustainability database, but for the sustainability data hiding inside everyone else's databases.

Where each piece hides

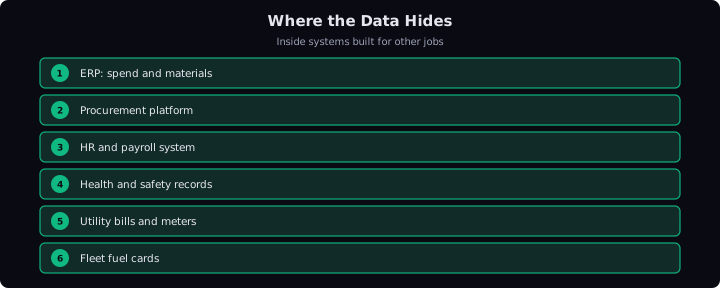
The map is surprisingly stable across companies. The ERPEnterprise resource planning, the core system that runs finance, purchasing and inventory. It holds spend and materials data that reveals a great deal about a company's emissions and resource use. system, which runs finance, purchasing and inventory, holds spend and materials data that reveals a great deal about emissions and resource use. The procurement platform knows what was bought, from which supplier, in what quantity, the backbone of value-chain figures. The HR and payroll system holds headcount, turnover, pay and diversity data. Dedicated environment, health and safety records hold incidents, spills and waste. And the humble utility bills and meter readings, often just PDFs in an inbox or a folder, hold the raw energy data that most emissions figures rest on. Consider a firm's fleet fuel cards: the sustainability number lives in an expense system no one thought to look in.

Why the data hides

The data hides because no operational system was designed to surface it. An ERP records a purchase to pay an invoice, not to calculate a carbon footprint, so the sustainability-relevant field is buried among a hundred others. A safety system logs an incident for compliance, not for a social report. Each system does its own job well and simply happens to hold, as a by-product, a figure the sustainability report needs. This is why the data feels invisible even though it is present: it is filed under a different intention. The skill this lesson builds is to look past what a system was built for and see the sustainability data it quietly carries.

Most sustainability data already sits inside everyday operational systems, filed under a different intention.

Check your understanding

Answer each from memory. Your results are saved in this browser and count toward your readiness — sign in (account panel above) to keep them across devices.

  1. What is a system of record?

  2. Where does the raw energy data behind most emissions figures usually hide?

  3. Why does sustainability data hide inside everyday operational systems?

13 min · Core

The Shadow-Data Problem

For all the data sitting in proper systems, the majority of sustainability data lives outside them, in an ungoverned world of spreadsheets, email threads and supplier PDFs. This shadow data is where numbers are transformed by hand, where lineage disappears, and where trust quietly breaks. Understanding it is essential, because it is where most reporting actually happens.

~4 min

By the end you can

  • Define shadow data and where it typically lives.
  • Explain why so much sustainability data ends up ungoverned.
  • Connect shadow data to the loss of traceability and trust.
  • Recognise shadow data as a structural risk, not mere untidiness.

The ungoverned majority

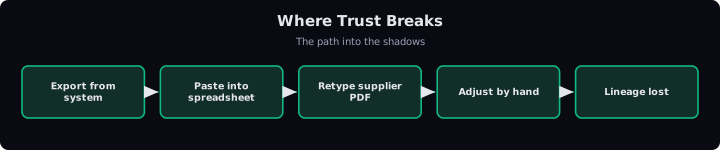
Even after a company finds the data in its proper systems, most of the sustainability reporting still happens somewhere else. The figures get exported into spreadsheets, pasted into emails, and combined with supplier numbers that arrive as PDF attachments. This is shadow data: information that has left the governed systems and now lives in personal files no one manages, backs up properly, or controls. For most firms this ungoverned layer, not the tidy systems, is where the real reporting work is done, which makes it the single most important place to understand.

Why the data drifts into the shadows

Shadow dataSustainability information that has left the governed systems and lives in personal spreadsheets, email threads and supplier PDFs that no one manages, backs up or controls, where much of the reporting actually happens. is not a sign of careless people; it is the natural result of a missing home. When the proper systems each hold only a fragment and none of them can combine the fragments, someone has to bring the pieces together, and the only tool always at hand is a spreadsheet. A supplier sends its emissions figure as a PDF because it has no better channel, so an analyst retypes it. The ERPEnterprise resource planning, the core system that runs finance, purchasing and inventory. It holds spend and materials data that reveals a great deal about a company's emissions and resource use. export will not talk to the HR export, so both are pasted into one sheet. Each step is reasonable on its own, and together they push the true calculation out of any governed system and into the shadows.

Where trust breaks

The shadows are precisely where trust breaks. Every time a figure is retyped, copied between tabs or adjusted with a manual formula, its link back to the original source weakens, and once that link is gone the number cannot be checked. A supplier PDF becomes a cell in a spreadsheet with no record of who sent it or when. A hand-built formula encodes an assumption no one wrote down. Picture an auditor asking to see how a value-chain figure was reached and being handed a spreadsheet with twelve tabs, formulas referencing deleted rows, and a comment that simply reads adjusted. The number may even be correct, but it can no longer be defended, and in the assured, legally exposed world of the last module, undefendable is as bad as wrong.

A structural risk, not untidiness

It is tempting to treat shadow data as mere mess to be cleaned up. That underestimates it. Shadow data is a structural risk because it is where the most important transformations happen with the least control: the combining, the estimating, the adjusting that turns raw fragments into the headline figure. The polished number in the annual report often rests entirely on a spreadsheet chain no governed system ever saw. Naming shadow data as the fault line, rather than a housekeeping nuisance, is what lets a business see why simply buying more systems does not fix trust. The fix has to reach the shadows, and the first step to reaching them is knowing they exist.

Figures leave governed systems, get retyped and adjusted by hand, and lose the lineage needed to defend them.

Check your understanding

Answer each from memory. Your results are saved in this browser and count toward your readiness — sign in (account panel above) to keep them across devices.

  1. What is shadow data in the context of sustainability reporting?

  2. Why does so much sustainability data end up in the shadows?

  3. Why is shadow data best understood as a structural risk rather than mere untidiness?

12 min · Core

Owners, Holders and Reporters

A single sustainability figure passes through three different roles: the person who produces it, the system or team that holds it, and the team that reports it. These are rarely the same, and confusing them is a common cause of unreliable data. Separating owner, holder and reporter is the piece of shared language that makes accountability possible.

~4 min

By the end you can

  • Distinguish the producer, the holder and the reporter of a data point.
  • Explain why these three roles are usually different people or systems.
  • Connect confusion of these roles to gaps in accountability.
  • Assign the three roles for a concrete sustainability figure.

One number, three roles

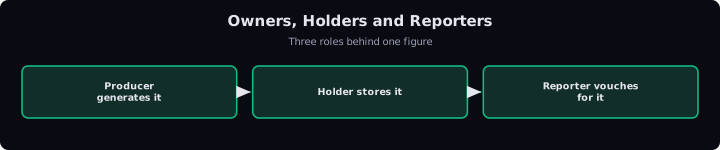
Behind every sustainability figure stand three distinct roles, and treating them as one is a frequent source of unreliable data. The producer is whoever or whatever generates the number in the first place: the meter that records energy, the supplier that calculates its own emissions, the payroll process that captures a pay gap. The holder is the system or team that stores and safeguards it: the facilities team with the meter data, the procurement platform with the supplier figures. The reporter is the team that pulls the number into the official disclosure and stands behind it, usually the sustainability or finance function. Owner, holder and reporter answer three different questions: who made it, who keeps it, and who vouches for it.

Why they are almost never the same

These roles separate naturally because the data crosses so many hands. The producer of value-chain emissions is a supplier the company does not control. The holder might be a procurement system, or an inbox, or a spreadsheet. The reporter is a sustainability analyst who never touched the original measurement and may be several steps removed from where it was produced. A workforce figure is produced by an HR process, held in a payroll system, and reported by a sustainability team that reads it second-hand. Because production, custody and disclosure sit in different places, the three roles rarely collapse into one person, and pretending they do hides the distance the number has travelled.

Where accountability falls through

Confusing the roles is where accountability quietly disappears. If the reporter assumes the holder has checked the figure, and the holder assumes the producer got it right, no one has actually verified it, yet everyone believes someone did. When an auditor asks who is accountable for a value-chain number, the honest answer is often that three parties each touched it and none owns it. This is the gap that turns a plausible figure into an indefensible one. The producer knows how it was measured but not how it is used; the reporter knows how it is used but not how it was measured; and the truth about the number lives in the space between them that no one is watching.

Separating the roles restores control

The remedy is not more effort but clearer language. Once a business names, for each important figure, who produces it, who holds it and who reports it, the gaps become visible and can be closed. A supplier emissions figure gains a named producer to query, a named holder to store it with its origin intact, and a named reporter answerable for it in the disclosure. This mirrors how financial data has long worked: a transaction has a source, a custodian and a controller, and everyone knows which is which. Applying the same discipline to sustainability data is a small step with a large payoff, because it converts a diffuse hope that the number is right into a specific chain of people who can each be asked.

Every figure has a producer who makes it, a holder who keeps it and a reporter who vouches for it.

Check your understanding

Answer each from memory. Your results are saved in this browser and count toward your readiness — sign in (account panel above) to keep them across devices.

  1. Which set correctly matches the three roles a sustainability figure passes through?

  2. Why are the producer, holder and reporter of a figure usually different?

  3. How does confusing these roles cause accountability to fall through?

14 min · Core

Drawing Your Data Map

Everything so far points to one first practical move: draw a map of where your sustainability data lives. A data map lists each figure you must report, and for each one names its family, its source system, whether it lives in the shadows, and its producer, holder and reporter. It is deliberately low-tech, and it is the step that turns scattered data into something you can build infrastructure on.

~4 min

By the end you can

  • Describe what a sustainability data map contains.
  • Explain why mapping comes before buying systems or setting targets.
  • Recognise the map as the first step toward treating data as infrastructure.
  • Apply the mapping method to a single reported figure.

Start with a map, not a system

The instinct when sustainability data feels chaotic is to buy software to fix it. That is premature. You cannot automate the flow of data you cannot yet describe, and most failed reporting projects begin by installing a system before anyone has mapped what the system is meant to hold. The first move is far humbler and far more valuable: draw a map of where the data actually lives. The map, not the software, is what converts a vague sense of chaos into a set of specific, solvable problems.

What the map contains

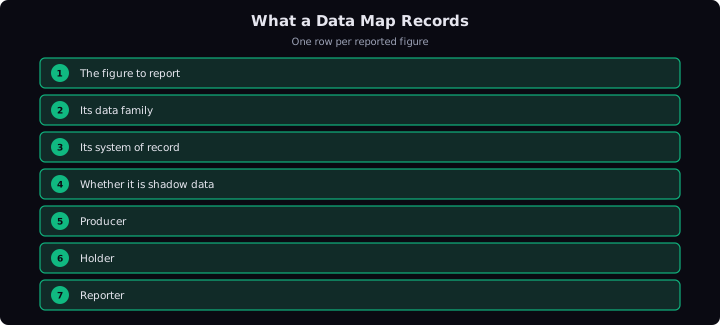
A data map is simply a structured inventory, one row per figure the business must report. For each figure it records a few things drawn straight from this module: which family it belongs to, which system of record it originates in, whether it currently lives in the shadows as a spreadsheet or PDF, and who its producer, holder and reporter are. A row might read: value-chain emissions for our top supplier, family supplier and value-chain, source the procurement platform plus an emailed PDF, shadow yes, producer the supplier, holder the procurement team, reporter the sustainability lead. Done across every required figure, the map shows at a glance where the data is solid and where it is fragile.

Why mapping comes first

Mapping earns its place at the front because it makes every later decision cheaper and better. It reveals which figures are already governed and which are hostage to a single spreadsheet. It shows where the same data is collected twice and where it is not collected at all. It tells a leader which suppliers matter most and which systems to connect first, so investment goes where the risk is, not where the loudest vendor points. Setting a carbon target before mapping is guessing; the map tells you which numbers you can actually stand behind today. Consider a firm that maps its data and discovers its largest emissions figure rests on one analyst's spreadsheet, that single finding redirects the whole programme.

The map as step one to infrastructure

The deeper point is that the map is the foundation the rest of the course builds on. Infrastructure means capturing each figure once, at source, and letting it flow to the report with its origin intact. You cannot build that flow until you know, for every figure, where it starts and where it must arrive, and the map is exactly that knowledge written down. It also becomes the shared artefact the whole cross-functional team can read together, sustainability, finance, IT and procurement each seeing their part in one picture. In the arc from compliance to strategy to trust, the map is the first concrete act of turning scattered data into infrastructure you can trust. It is where the theory of this module becomes something a business can start on tomorrow.

A data map inventories each figure by family, source, shadow status and its producer, holder and reporter.

Check your understanding

Answer each from memory. Your results are saved in this browser and count toward your readiness — sign in (account panel above) to keep them across devices.

  1. What does a sustainability data map record for each figure a business must report?

  2. Why should mapping the data come before buying systems or setting targets?

  3. Why is the data map described as the first step toward treating data as infrastructure?

Flashcards

Recall-first review of the load-bearing facts.

0 reviewed · 8 left

Ready to test yourself?

12 graded questions with real explanations. You commit a confidence before each reveal — that is how you find what you only think you know.

Start practice quiz →
Where the Data Lives — Sustainability Data as Infrastructure | Contested Futures Academy · The Contested Futures Institute